By J.D. Roth
July 26th, 2018

Now, I don’t necessarily disagree with this basic premise. I too believe that money you pay toward your mortgage principle is, in effect, money you’ve saved, just as if you’d put it in the bank or invested in a mutual fund. Many financial advisers say the same thing: Money you put toward debt reduction is the same as money you’ve invested. (Obviously, they’re not exactly the same but they’re close enough.) So, yes, paying off your home is saving for retirement. Or, more precisely, it’s building your net worth.
Looking past the “paying off your house is saving for retirement” subtitle on his piece, we get to his actual thesis: “Making mortgage payments can, in theory, be a way to accumulate wealth almost as effectively as contributing to a retirement fund.”
I’m glad Salmon qualified this statement with “in theory” and here’s how this “logic” works:
For this to be true, here’s what has to happen:
- Home prices in your area have to appreciate at an average of eight percent not just this year and next year, but for fifteen years.
- You have to take out a 15-year mortgage instead of a 30-year mortgage.
- You need to stay in that house (or continue to own it) for that entire fifteen years.
- Once you’ve become a millionaire homeowner, you now have to tap that equity for it to be of use. To do that, you have to sell your home, acquire a reverse mortgage, or otherwise creatively access the value locked in your home.
The real problem here, of course, are the assumptions about real estate returns. Salmon cites stats from 1996 to 2007, then 2011 to 2017 — and completely leaves out 2008 to 2010. This as if I ran a marathon and told you that I averaged four minutes per mile…but I was only counting the miles during which I was running downhill!
This isn’t how statistics work! You don’t get to cherry pick the data. You can’t just say, “Homes in some markets appreciated 9% annually from 1996 to 2007, then 8.3% annually from 2011 to 2017. Therefore, your home should increase in value an average of eight percent per year.” What about the gap years? What about the period before the (very short) 22 years you’re citing? What makes you think that the boom times for housing are going to continue?
Long-Term Home Price Appreciation
For 25 years, Yale economics professor Robert Shiller has tracked U.S. home prices. He monitors current prices, yes, but he’s also researched historical prices. He’s gathered all of this info into a spreadsheet, which he updates regularly and makes freely available on his website.
This graph of Shiller’s data (through January 2016) shows how housing prices have changed over time:
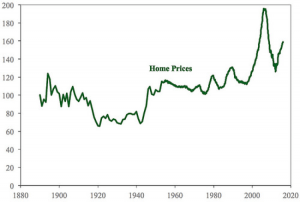
Shiller’s index is inflation-adjusted and based on sale prices of existing homes (not new construction). It uses 1890 as an arbitrary benchmark, which is assigned a value of 100.
As you can see, home prices bounced around until the mid 1910s, at which point they dropped sharply. This decline was due largely to new mass-production techniques, which lowered the cost of building a home. (For thirty years, you could order your home from Sears!) Prices didn’t recover until the conclusion of World War II and the coming of the G.I. Bill. From the 1950s until the mid-1990s, home prices hovered around 110 on the Shiller scale.
For the past twenty years, the U.S. housing market has been a wild ride. We experienced an enormous bubble (and its aftermath) during the late 2000s. It looks very much like we’re at the front end of another bubble today. As of December 2017, home prices were at about 170 on the Shiller scale.
Here’s the reality of residential real estate: Generally speaking, home values increase at roughly the same (or slightly more) than inflation.
Crunching the Numbers
I took the afore-mentioned housing data from Robert Shiller’s spreadsheet and combined it with the inflation-adjusted closing value of the Dow Jones Industrial Average for each year since 1921.
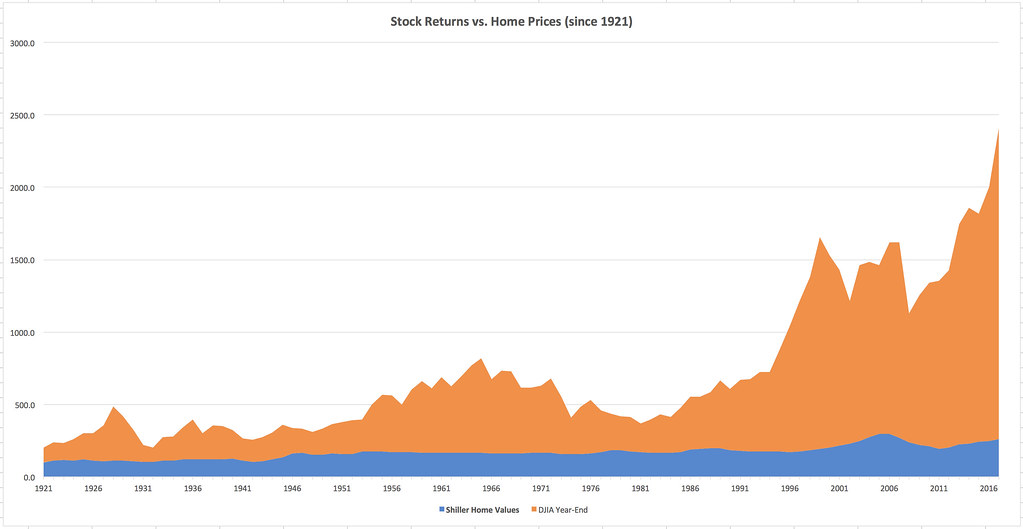
Let me explain what you’re seeing:
- First, I normalized everything to 1921. That means I set home values in 1921 to 100 and I set the closing Dow Jones Industrial Average to 100. From there, everything moves as normal relative to those values.
- Second, I’m not sure why but Excel stacked the graphs. They should both start at 100 in 1921, but instead the stock market graph starts at 200. There are a few places — 1932, 1947 — where the line for home values should actually overtake the line for the stock market, but you can’t tell that with the stacked graph.
As the chart shows, the stock market has vastly outperformed the housing market over the long term. There’s no contest. The blue housing portion of my chart is equivalent to the line in Shiller’s chart (from 1921 on, obviously).
Now, having said that, there are some things that I can see in my spreadsheet numbers that don’t show up in this graph. Because Felix Salmon at Slate is using a 15-year window for his argument, I calculated 15-year changes for both home prices and stock prices. I’ll admit that the results surprised me. Generally speaking, the stock market does provide better returns than homeownership. However, in 30 of the 82 fifteen-year periods since 1921, housing provided better returns. (And in 14 of 67 thirty-year periods, housing was the winner.) I didn’t expect that.
In each of these cases, housing outperformed stocks after a market crash. During any 15-year period starting in 1926 and ending in 1939 (except 1932), for instance, housing was the better bet. Same with 1958 to 1973. In other words, if you were to buy only when the market is declining, housing is probably the best bet — if you’re making a lump-sum investment and not contributing right along.
Another thing the numbers show is that you’re much less likely to suffer long-term declines with housing than with the stock market. Sure, there are occasional periods where home prices will drop over fifteen or thirty years, but generally homes gradually grow in value over time.
The bottom line? I think it’s perfectly fair to call your home an investment, but it’s more like a store of value than a way to grow your wealth. And it’s nothing like investing in the U.S. stock market.
Source: Get Rich Slowly
https://www.getrichslowly.org/home-investment/
